AIOps for Capacity Planning: Best Tools Guide
Capacity planning stopped being an annual spreadsheet exercise the moment infrastructure became elastic, ephemeral, and billed by the second. Teams running…

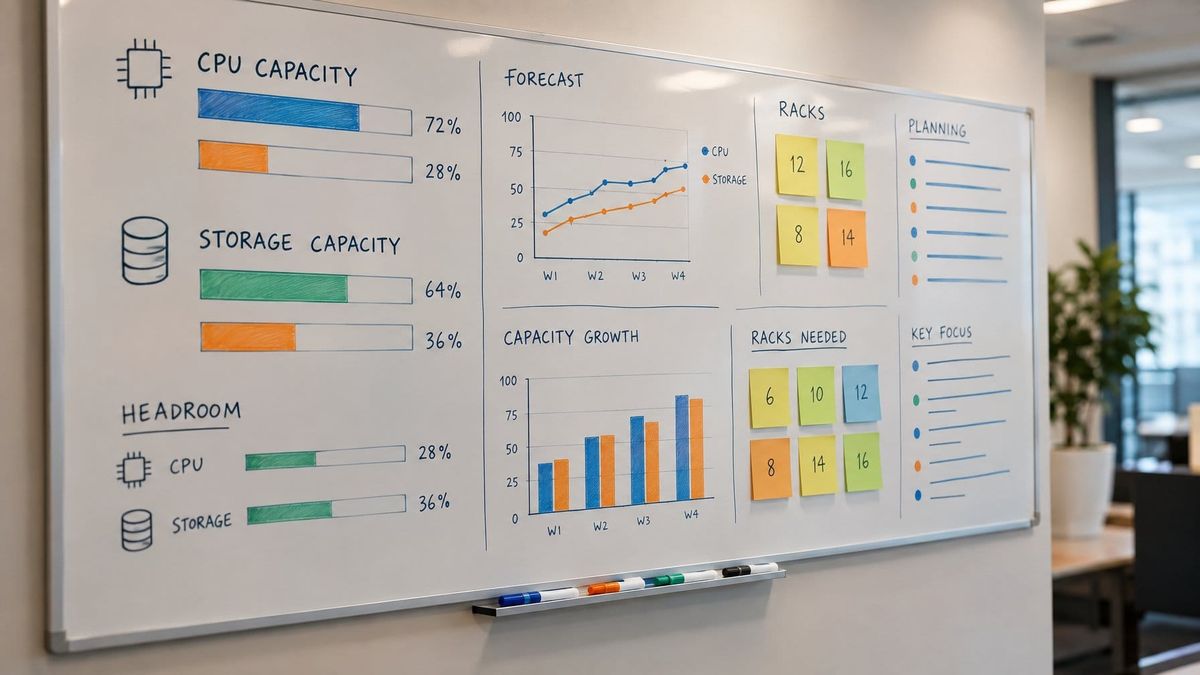
Capacity planning stopped being an annual spreadsheet exercise the moment infrastructure became elastic, ephemeral, and billed by the second. Teams running Kubernetes, managed databases, and multi-cloud estates now generate more telemetry in a week than a planner can read in a year, and the constraint that breaks production is rarely the one being watched.
For teams that already collect metrics, logs, and traces at scale, an observability platform with built-in forecasting is the fastest route to AIOps for capacity planning, because the forecast runs on telemetry already in the system rather than a separate data pipeline. Dynatrace, for example, publishes that its Davis AI forecasting service tracks over 8,000 disks requiring periodic resizing inside Dynatrace's own cloud infrastructure, with a scheduled weekly forecast that replaces after-hours reactive alerts; that same setup predicts when free disk capacity will cross a critical threshold weeks before the shortage lands.
Teams whose primary pain is cloud spend, not reliability, get more from a FinOps-focused capacity specialist. Teams drowning in correlated alerts across a sprawling estate get more from a full AIOps suite whose capacity module sits on top of incident data. The distinction shapes everything from integration work to how much of the forecast a platform will act on automatically.
Key Takeaways
- AIOps capacity planning turns existing telemetry into forecasts of which resource will saturate first and when.
- Autoscaling handles minute-to-minute demand; forecasting handles quota, reservation, redundancy, and budget decisions weeks ahead.
- Buyers should test forecast explainability, integration coverage, and automation hooks against their own historical data before committing.
From Telemetry to Capacity Decisions
AIOps for capacity planning works by applying machine learning and statistical baselining to the telemetry an organization already collects, then projecting that history forward to estimate when a specific resource runs out of headroom. Artificial intelligence for IT operations platforms ingest logs, metrics, traces, and events, normalize them, and correlate signals across compute, storage, and network so long-term patterns become visible.
IBM describes analytics that interpret raw data to help teams identify trends, isolate problems, and predict capacity demands across network components and data sources.
Which Signals Should Feed a Capacity Forecast?
Five signal families do most of the work: resource utilization time-series data (CPU, memory, disk, network I/O), saturation indicators, request-rate growth, queue and connection-pool depth, and storage growth rate. Google's SRE guidance treats saturation as a core monitoring signal precisely because it flags a constraint before customers feel latency.
Events matter as much as metrics. Deployment markers, feature-flag rollouts, autoscaling events, and configuration changes explain why demand moved. Without them, a release regression looks identical to organic growth, and the forecasting model learns the wrong lesson.
Tagging discipline is the unglamorous prerequisite. Inconsistent service naming across environments makes forecasts drift because the model is projecting the wrong entity.
How AIOps Finds the Next Resource Constraint
The useful output is a ranked constraint list, not a single utilization number. Predictive models combine growth trend with saturation signals to identify where growth turns into performance risk first: CPU throttling, memory pressure, storage I/O wait, IOPS ceilings, connection exhaustion, or bandwidth near its limit.
Anomaly detection contributes by separating three pattern types that a linear projection would blend together. Seasonality (end-of-month billing, year-end peaks) behaves differently from inorganic spikes tied to campaigns, which behave differently again from structural growth in users or data volume.
Google Cloud frames this as running trend analysis and capacity planning algorithms to proactively identify potential performance bottlenecks and optimize resource allocation.
Why Incident Context Matters for Capacity Risk
Incident management data turns a forecast into a risk assessment. A service that has generated three latency incidents at 60% CPU has a lower effective ceiling than a service that runs clean at 85%, and only incident history reveals that.
Root cause analysis records also tell planners which past shortages were true demand and which were fragmentation, failed jobs, or policy limits. Capacity guidance for AI infrastructure makes this point sharply: high utilization alone is not a purchase trigger if workloads complete on time, while moderate utilization can conceal a critical capacity gap for one hardware type or topology.
Linking forecasts to incidents also attacks alert fatigue. Replacing dozens of static-threshold warnings with one scheduled forecast report cuts noise while extending lead time.
What Forecasts Can and Cannot Automate
Forecasts reliably automate detection, projection, and notification. Scheduled forecasting workflows can run predictions across thousands of resources, compare each against a critical limit, and produce a single actionable list, with fully automated provisioning added later once the team trusts the output.
Models cannot anticipate what the roadmap has not shipped. A forecast trained on live telemetry has no knowledge of next month's launch, a planned data backfill, or a large customer onboarding, so human review against a known-events calendar remains part of the loop.
Reactive alerting stays in place as the last line of defense. A weekly forecast will not catch a customer onboarding thousands of agents on a Sunday morning.
When Predictive Planning Beats Spreadsheets and Cloud Advisors
Predictive capacity planning earns its cost when resource allocation decisions carry lead time, when multiple resource types compete to become the bottleneck, and when the estate is too large to sample by hand. Spreadsheet forecasts and cloud advisor recommendations both look at what happened; a capacity model built on historical utilization data estimates when a constraint arrives and how confident that estimate is.
Which Workloads Benefit Most From Forecasting?
Stateful and lead-time-bound workloads benefit most. Database instances sit at the top of the list because a tier upgrade needs a maintenance window rather than a scale-out event.
One engineering account describes an RDS instance at 52% CPU that traditional monitoring called healthy, while a growth-rate projection put it 47 days from 80% CPU, turning an emergency into a scheduled instance-class upgrade.
Other strong candidates:
- Storage tiers and data warehouse capacity, where growth is monotonic and tier changes are contractual
- Network bandwidth and egress, where limits appear at the load balancer or edge
- Reserved or committed-use purchases, where a 12-month decision needs a 12-month forecast
- Quota-bound resources such as GPU pools, IP ranges, and connection limits
Stateless services with generous autoscaling headroom gain the least from long-range forecasting and the most from rightsizing analysis.
Why Autoscaling Does Not Replace Capacity Planning
Autoscaling reacts inside a range that someone has to set. A horizontal pod autoscaler respects max replicas, node group ceilings, cloud quotas, and the size of the underlying instance pool, and every one of those numbers is a capacity planning output.
Autoscaling also hides demand. Utilization looks comfortable while the scaler quietly consumes headroom, which is why forecasts should model the aggregate pool alongside per-instance utilization.
Under-provisioning shows up as incidents and emergency scaling. Over-provisioning shows up as a quiet, permanent inflation of cloud spend. Forecasting narrows the gap between those two failure modes instead of picking one as insurance.
How to Set Headroom, Redundancy, and Cost Guardrails
Tie headroom to SLOs and to lead time. A practical pattern alerts at 80% capacity with 60 days of runway, which leaves room to plan, provision, and load test without panic.
Three guardrails keep a capacity model honest in production:
| Guardrail | Rule of thumb | Failure it prevents |
|---|---|---|
| Minimum data window | Never project from under 14 days; compare 30-day and 90-day trends | Extrapolating a three-day spike into 300% weekly growth |
| Known-events calendar | Manually adjust projections around launches and campaigns | Linear models missing a scheduled demand step |
| Threshold headroom | Trigger at 80% utilization, not 90% | Scaling after users already feel degradation |
Redundancy sits on top of that. Capacity available only when every node is healthy is not capacity, so N+1 or N+2 targets belong in the model rather than in a footnote.
How to Compare AIOps Capacity Planning Platforms
Platform selection turns on four questions: where the data comes from, how the forecast is produced and explained, what the platform will do with the forecast, and what the whole arrangement costs once data volume grows. Category matters too, because an observability vendor, an AIOps suite, and a FinOps specialist each solve a different first problem.
Full AIOps Suites vs. Observability Platforms vs. FinOps Specialists
| Criterion | Full AIOps suite | Observability platform with capacity AI | Cloud FinOps / capacity specialist |
|---|---|---|---|
| Primary job | Event correlation, incident reduction, MTTR | Metrics, logs, traces plus forecasting on the same data | Spend attribution, rightsizing, commitment planning |
| Capacity data source | Aggregated events from other tools | Native telemetry already collected | Cloud provider APIs and billing data |
| Best forecast target | Cross-domain, incident-linked risk | Per-resource saturation and headroom | Cost per workload, reservation coverage |
| Typical automation | Runbook and workflow triggers | Scheduled forecast workflows, remediation actions | Rightsizing recommendations, commitment purchases |
| Weakest fit | Teams with clean telemetry and few alerts | Teams whose pain is billing, not reliability | Teams needing reliability forecasts, not spend |
Predictive capacity planning is where AIOps and FinOps meet, and a description of the overlap frames it as operational forecasting connected directly to cost. Buyers running both mandates should expect to pair two tools rather than find one that leads on both.
How to Assess Data Sources, Coverage, and Integration Fit
Map every environment that must appear in one forecast before shortlisting. AWS, Azure, and GCP accounts, Kubernetes clusters, Prometheus endpoints, on-premises hypervisors, and managed data services each need a supported collector, and gaps in coverage produce forecasts that model a fraction of the estate.
Check how the platform reads cloud provider APIs for quota and limit data, since a forecast that ignores account quotas will predict growth into a ceiling it cannot see. Ask whether cloud orchestration and Terraform state can be referenced so capacity recommendations map to real infrastructure definitions.
Two integration details decide implementation effort. Deployment markers from CI/CD pipelines let the model distinguish release regressions from demand growth, and consistent tagging across accounts determines whether per-team or per-service forecasts are possible at all.
What Forecast Accuracy and Explainability Should Buyers Test
Run a backtest before signing. Load 90 days of the organization's own metrics, ask the platform to forecast the most recent 30, and compare predicted versus actual for the resources that carry real risk.
Explainability is the second test. Buyers should ask which model produced a given projection, whether that choice was automatic, and how seasonality was detected. Some platforms use an AutoML approach that analyzes variance, seasonality, trend, and noise to select a prediction model, and disclose the algorithm set in product documentation.
Probabilistic output beats point estimates. An upper and lower bound lets planners act on the worst case, which is exactly how a lower-bound disk forecast triggers a resize before the drive fills.
Teams with data science capacity may prefer platforms exposing Python model serving so a custom Prophet, SARIMA, or LSTM network model can run beside the vendor's own. Research on adapting AIOps capacity forecasting models notes that companies employ these models to predict resource demand for CPU and memory in a timely fashion, which also means production deployment and retraining become the buyer's ongoing work.
Which Automation, Pricing, and Time-to-Value Questions Matter
Automation should be staged. A defensible sequence starts with scheduled forecast reports, adds ticket creation and runbook triggers, then permits autonomous scaling for well-understood resource classes once forecast accuracy is proven.
Pricing questions to settle in writing:
- Whether billing is per host, per ingested GB, per metric series, or per monitored resource
- Whether forecasting and AI features sit in a premium tier or carry separate consumption charges
- Data retention length, since long-range forecasts need long history
- Cost of adding a new cloud account, cluster, or region mid-term
StackRundown's coverage of hidden costs in AI SaaS platforms applies directly here, because usage-metered ingestion is the line item most likely to exceed the quoted entry price.
On time-to-value, PagerDuty's own CIO checklist argues buyers should not need to hire data scientists to get value from an AIOps solution, which is a reasonable bar to hold every vendor to during a pilot.
Better Capacity Outcomes Depend on Forecasts, Guardrails, and Ownership
Predictive capacity planning delivers value when three pieces are in place together. Forecasts need consistent telemetry with deployment markers and clean tagging. Guardrails need explicit numbers: a minimum 14-day data window, an 80% trigger threshold, a known-events calendar, and N+1 redundancy baked into the model rather than assumed.
Ownership closes the loop. Capacity planning answers what the organization will need and when; IT operations keeps current infrastructure reliable today, and one accountable owner for each prevents forecasts from dying in committee. Naming who can change quotas, reserve capacity, or approve burst spend turns a projection into a decision.
For SRE, DevOps, and FinOps teams starting out, the cheapest first move is a backtest on existing data for the three resources whose exhaustion would take the system down. That exercise reveals whether the platform's forecast beats a trend line, and whether the integration work ahead is worth the license.
Frequently Asked Questions
What is AIOps for capacity planning?
AIOps for capacity planning applies machine learning and big data analytics to IT telemetry (logs, metrics, traces, and events) to forecast when a resource will run out of headroom. Platforms correlate growth trends with saturation signals to identify which resource becomes the constraint first, then feed that projection into scaling, reservation, and budget decisions.
What are the three types of capacity planning?
Capacity planning is commonly divided into lead strategy (adding capacity ahead of forecast demand), lag strategy (adding capacity after demand materializes), and match strategy (adding capacity in smaller increments as demand develops). In infrastructure terms, lead strategy maps to reserved capacity ahead of a known peak, and match strategy maps to incremental scaling tied to a rolling forecast.
Can autoscaling replace capacity planning?
Autoscaling handles demand inside limits that capacity planning defines, including max replicas, node group ceilings, and cloud account quotas. It also masks demand growth, since utilization can look stable while the scaler consumes pool headroom, so the aggregate pool still needs a forecast.
What is the best tool for capacity planning?
For teams already running full-stack observability, a platform with native forecasting on existing telemetry gives the shortest path, since no separate data pipeline is required. Teams whose primary goal is cloud cost efficiency should evaluate FinOps and rightsizing specialists that read cloud provider billing and API data, while organizations fighting alert volume across a large estate get more from a full AIOps suite with a capacity module.
How do AIOps forecasts reduce cloud costs without increasing risk?
Forecasts identify resources consistently underutilized and eligible for downsizing, while separately flagging services where constraints are starting to affect performance. Acting on both lists at once trims over-provisioning and prevents under-provisioning, and probabilistic bounds let teams size against the worst case instead of the average.