2026 SaaS Benchmarks: Resource Utilization Trends
Benchmarks and fixes for SaaS cloud waste—CPU, memory, GPU use, cost-per-user, rightsizing, storage, and GPU sharing.


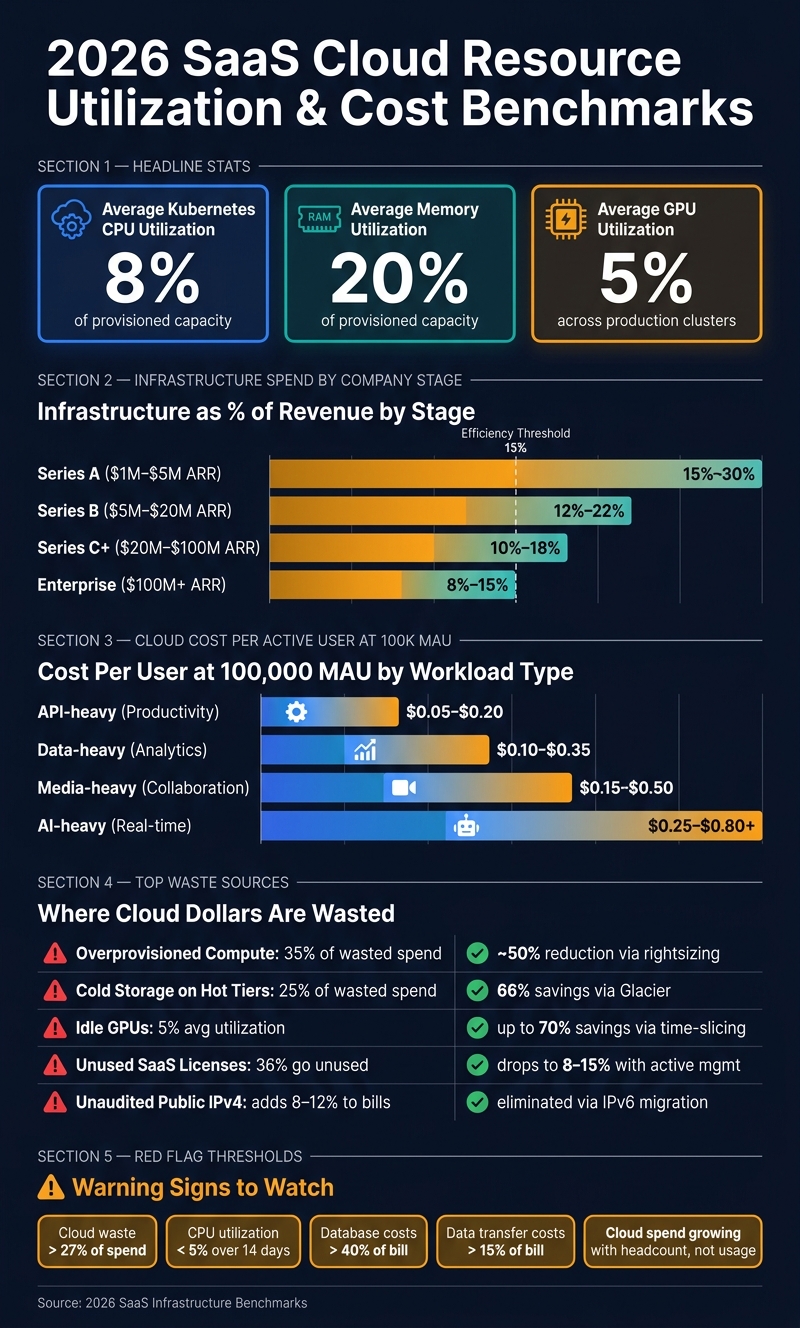
Most SaaS teams pay for far more cloud capacity than they use. In 2026, average Kubernetes CPU use is just 8%, memory use is 20%, and GPU use is 5%. That gap shows up in margins fast, especially when infrastructure spend should usually stay around 15%–20% of revenue for healthy SaaS businesses.
If I were sizing up my own numbers, I’d focus on this first:
- Cloud waste past 27% is a red flag
- CPU use below 5% over two weeks often means heavy overprovisioning
- Cost per active user should fall as MAU grows
- Architecture choices shape efficiency more than traffic alone
- Rightsizing, GPU sharing, and storage cleanup tend to cut waste the fastest
Here’s the short version: if my cloud bill is growing faster than revenue, if idle capacity stays high, or if per-user cost is not dropping with scale, I’d treat that as a warning. And I would not look at compute alone. I’d also check storage, data transfer, observability, licenses, and public IPv4 spend.
A few benchmark bands help frame the picture:
- Series A: infrastructure often lands at 15%–30% of revenue
- Series B: 12%–22%
- Series C+: 10%–18%
- Enterprise: 8%–15%
- At 100,000 MAU, cost per user often ranges from $0.05 for API-heavy apps to $0.80+ for AI-heavy products
| Area | What I’d Compare | What the article points to |
|---|---|---|
| Revenue efficiency | Infrastructure as % of revenue | Healthy range often trends down with scale |
| User efficiency | Cloud cost per active user | Should drop as MAU grows |
| Resource use | CPU, memory, GPU utilization | Low averages often mean waste |
| Architecture | Multi-tenant vs. single-tenant vs. container-per-tenant | Setup changes utilization a lot |
| Waste control | Rightsizing, storage tiering, GPU sharing | These fixes move costs the most |
So this piece is less about chasing one perfect number and more about spotting drift early. If I’m above range for a clear reason, that can be fine. But if I’m above range because of idle nodes, padded requests, or flat usage with rising spend, that’s where I’d start digging.
2026 SaaS Cloud Resource Utilization & Cost Benchmarks
Key 2026 SaaS benchmark ranges to know
Infrastructure spend as a share of revenue by company stage
Infrastructure spend should change as your company grows. Early on, the ratio is usually higher because fixed costs don't shrink until you have enough users to spread them across. As ARR goes up, infrastructure should take a smaller share of revenue. If that isn't happening, it's worth digging into why.
Typical spend ranges by stage look like this:
| Company Stage | ARR Range | Infrastructure % of Revenue |
|---|---|---|
| Series A | $1M – $5M | 15% – 30% |
| Series B | $5M – $20M | 12% – 22% |
| Series C+ | $20M – $100M | 10% – 18% |
| Enterprise | $100M+ | 8% – 15% |
A ratio below 15% is efficient. Once you're above 25%, it often points to infrastructure that was built out too far ahead of demand. Start with this range, then look at workload mix to see whether an outlier makes sense.
For teams running production AI workloads, those deployments now make up 15%–25% of total cloud spend.
Cloud cost per active user by SaaS workload type
Revenue-share benchmarks tell you how well costs scale. Per-user cost tells you what kind of workload you're dealing with. Both matter.
Per-user cost tends to drop fast as you grow. Going from 1,000 to 10,000 MAU usually cuts cost per user by 60%–70%, simply because fixed infrastructure is spread across more users. But scale isn't the whole story. A media-heavy app and an AI-heavy app can look nothing alike on the cost side, even at the same user count.
At 100,000 MAU, typical cost-per-user ranges by workload look like this:
| Workload Category | Cost-per-User Range (100K MAU) | Typical Profile | Common Bottlenecks |
|---|---|---|---|
| API-heavy (Productivity) | $0.05 – $0.20 | CRMs, project management, REST/GraphQL | Database CPU, compute |
| Data-heavy (Analytics) | $0.10 – $0.35 | Complex queries, ML-powered reporting | Database I/O, internal data transfer |
| Media-heavy (Collaboration) | $0.15 – $0.50 | Video/photo platforms, user-generated content | Storage, egress, transcoding |
| AI-heavy (Real-time) | $0.25 – $0.80+ | LLM inference, GPU-bound workloads | GPU idle time, memory pressure |
If you're checking your own numbers, lean targets by scale are:
- $0.75 per user at 1,000 MAU
- $0.35 at 10,000 MAU
- $0.12 at 100,000 MAU
- $0.03 at 1,000,000 MAU
CPU, memory, and observability overhead in multi-tenant environments
Low utilization often comes from padded resource requests, not just low demand. Overprovisioning is still the main source of waste: CPU requests are up 69% year over year, and memory requests are up 79% year over year. A lot of that comes from teams adding extra headroom to avoid OOM kills.
The warning signs are pretty clear. Waste becomes a real problem when total cloud waste goes past 27% of spend or when average CPU utilization stays below 5% over a 14-day window. Observability should also be tracked as its own line item, not rolled into everything else.
sbb-itb-fd683fe
Unit Economics: Cloud Cost Metrics that Matter to the Business
What is driving resource utilization trends in 2026
In 2026, architecture choices matter as much as traffic. In many cases, they matter more. The main gaps in utilization come from how a system is built and how much idle capacity that setup leaves behind.
Multi-tenant, single-tenant, and container-per-tenant trade-offs
Tenant design shapes utilization, isolation, and fixed overhead.
| Deployment Model | Utilization Tendency | Strengths | Weaknesses | Typical Fit |
|---|---|---|---|---|
| Single-Tenant (Silo) | Low (8–15%) | Maximum isolation; easiest compliance for HIPAA/PCI | High management overhead; idle capacity | High-compliance enterprise tiers |
| Shared-Schema Multi-Tenant | High (40–60%) | Best cost efficiency; simplified updates | Tenant interference; harder isolation | Early-stage startups; high-volume product-led growth apps |
| Container-per-Tenant | Moderate (20–35%) | Good balance of isolation and automation | Sidecar and control-plane overhead | Growth-stage B2B SaaS with varied workloads |
Single-tenant systems give you the most isolation, but they also leave more capacity sitting unused. Shared-schema multi-tenancy usually drives the highest utilization because many tenants share the same base resources. Container-per-tenant lands in the middle. It offers a cleaner split between tenants, but orchestration overhead eats into efficiency.
That’s why two SaaS companies with similar traffic can end up in very different utilization ranges. The traffic may look alike. The architecture does not.
The same thing happens with platform overhead and autoscaling.
Microservices, orchestration, and the hidden cost of platform overhead
Microservices can make deployment faster, but every extra layer adds fixed overhead. Kubernetes clusters still run logging, metrics, security, and service-mesh parts whether traffic is heavy or quiet.
And here’s the rub: cloud bills follow nodes, not pods. That gap is where a lot of waste piles up. If you spin up separate clusters for each environment, each one brings its own flat control-plane fee - about $73/month per cluster for EKS or GKE. So even if request volume doesn’t change, platform layers can still push CPU and memory waste higher.
Linkerd 2.20 reportedly cut its control plane memory by 85% to deal with this exact overhead pattern in 2026.
AI-driven autoscaling and workload scheduling
The biggest gains in utilization now come from dynamic scheduling, not fixed requests.
AI-driven autoscaling swaps static Helm requests for rightsizing based on actual P95 usage. That shift cuts provisioned CPU footprint by about 50% and reduces memory-starved crashes. GPU utilization is still near 5%, which means bursty inference workloads have the most to gain from smarter schedulers and time-slicing.
Tools like Karpenter - now used by 40% of EKS clusters - pick better instance types based on pending pod needs instead of waiting to react later. For bursty inference, GPU time-slicing lets multiple workloads share one costly GPU instance.
The next section looks at where waste still shows up most often and which fixes move these benchmarks the fastest.
Where SaaS teams waste resources and what benchmarks say works
The most common sources of waste in 2026 SaaS stacks
In 2026, the biggest waste buckets in SaaS stacks are compute, storage, GPUs, licenses, and IPv4. That’s where money tends to leak first. And the benchmark data makes the pattern pretty clear: a handful of fixes can move the numbers fast.
Compute alone accounts for 35% of all wasted cloud dollars, with storage right behind it at 25%. Then there are the quieter costs that sneak into the bill. Public IPv4 addresses cost about $3.65 per month each, which can add 8%–12% to poorly managed stacks.
| Waste Source | Typical Impact | Typical Gain |
|---|---|---|
| Overprovisioned compute | 35% of wasted cloud spend | ~50% footprint reduction via rightsizing |
| Idle GPUs | 5% average utilization | Up to 70% savings via time-slicing and sharing |
| Cold storage on hot tiers | 25% of wasted cloud spend | 66% savings by moving to Glacier Instant Retrieval |
| Unused SaaS licenses | 36% of all licenses go unused | Waste drops to 8%–15% with active management |
| Unaudited public IPv4 addresses | Adds 8%–12% to poorly managed stacks | Eliminated by migrating to private/IPv6 addressing |
How utilization patterns differ across productivity, analytics, and AI-heavy SaaS
The same kinds of waste show up in different ways depending on the product.
For productivity SaaS, the problem is mostly seat-based. In large collaboration suites, inactive or sub-threshold usage seats hit 31%. This isn’t a fancy engineering issue. It usually comes down to tighter provisioning and regular license audits.
For analytics and data platforms, the pain is more about storage and data transfer. Cross-AZ traffic at $0.01/GB per direction and NAT Gateway processing at $0.045/GB start looking like real budget items once query volume climbs. On top of that, unattached volumes and forgotten snapshots tend to pile up quietly between billing cycles.
For AI-heavy SaaS, the issue is harder to ignore: low utilization paired with high spend. GPU utilization averages only 5% across production clusters, while idle high-end GPUs still cost dollars per hour. If teams keep hoarding GPU capacity, utilization drops even more, and the bill keeps rolling.
Optimization practices with the clearest benchmark impact
Automated rightsizing shows the strongest return most often. Mercedes-Benz.io used continuous rightsizing to scale Kubernetes workload requests against actual consumption. The result was a roughly 50% cut in provisioned CPU footprint, while out-of-memory kills dropped to near zero.
"The teams that stopped overprovisioning didn't get less reliable – they got more reliable. The same mechanism that eliminates waste also catches the memory-starved workloads that humans miss." - Laurent Gil, Co-Founder and President of Cast AI
For GPU workloads, time-slicing and node bin-packing stand out. ALLEN Digital migrated 7 models from SageMaker to Kubernetes in 2025–2026, using a 50/50 on-demand/Spot split along with GPU time-slicing. That pushed total savings to more than 70% compared to its previous SageMaker setup.
There’s also multi-model AI routing. Sending simpler tasks to lower-cost models like GPT-4o-mini and saving premium models for harder work cuts inference costs by 40%–60%.
On the storage side, the fix is often less dramatic but still worth doing. A two-hour audit of unattached volumes and S3 lifecycle policies usually recovers 15%–25% of storage spend. And moving objects that haven’t been accessed in 30+ days to Glacier Instant Retrieval cuts those storage costs by 66%.
Use these waste patterns to size your monthly review.
How to apply these benchmarks to your SaaS business
A simple monthly review framework for U.S. SaaS teams
Use the benchmark ranges above as your monthly baseline. Then, once a month, pull two numbers: total cloud spend and monthly active users (MAU). From there, calculate cost per active user with this formula: Total Monthly Cloud Spend ÷ MAU.
If that number drops month over month, you’re usually scaling in a healthier way. If it stays flat or starts creeping up, take a closer look.
Focus on five core metrics each month:
- Infrastructure spend as a percent of revenue
- Cost per active user
- CPU and memory utilization bands
- Storage growth rate
- Observability spend
It also helps to give one person clear ownership of this review. That matters because 61% of teams struggle to attribute costs to products or features.
You’ll also want to break costs out by workload type. Core app traffic, analytics pipelines, and AI inference features do not cost the same to run. An API-heavy product and a media-heavy product can show very different per-user costs even at the same MAU. That split helps you tell the difference between spend that makes sense and spend that points to waste.
When being above benchmark is acceptable and when it is a warning sign
Being above benchmark isn’t automatically bad.
Early-stage teams often overprovision on purpose. If your app goes down, the damage from underprovisioning can cost more than a bigger cloud bill. Fintech and healthcare SaaS companies also tend to run higher infrastructure costs. Spending 10–20% of revenue on infrastructure is common when rules like PCI-DSS and SOC 2 add extra overhead. And if you run an AI-heavy product, cloud spend at 25–40% of revenue doesn’t make you an outlier. GPU-heavy workloads are just expensive by nature.
The red flags are more concrete. Dig in right away if:
- Database costs go past 40% of the bill
- Data transfer goes past 15%
- Cloud spend grows with headcount instead of usage
There’s a broader pattern to watch too. Spend turns into a problem when cloud costs don’t grow more slowly than revenue, or when idle capacity, overprovisioning, and utilization drift keep piling up without action.
Conclusion: 2026 benchmark takeaways for founders
Treat these benchmarks as drift signals, not fixed goals.
The best teams review unit cost, utilization, and reliability together every month. Architecture choices like multi-tenancy, rightsizing, and workload scheduling do more to shape your efficiency ceiling than any one-off fix. Benchmark ranges help teams spot inefficiency early, then use automation and workload segmentation to deal with it.
FAQs
How do I benchmark cloud spend against revenue?
Track infrastructure costs as a share of total revenue. For SaaS companies, the usual benchmark for cloud infrastructure is 8% to 15% of revenue.
Early-stage companies often land near 15%. More mature companies usually get down to 8% to 10% as revenue grows faster than infrastructure costs.
If your ratio sits above that range, dig into compute waste. On average, it makes up 35% of cloud spend.
What should I audit first if utilization is low?
Start with a formal utilization review.
Pull together your current SaaS inventory, including the vendor, cost, total seat count, and owner. Then check which active users completed a core action in the past 30 days.
If utilization falls below 70% of purchased seats, that usually points to underuse. At that point, the tool owner should figure out whether the drop is temporary or if the product no longer fits how the team works.
When is being above benchmark okay?
Being above a benchmark can be perfectly fine when it lines up with high-growth performance, especially in an early, fast-growth stage. A company growing more than 50% year over year, for example, might run a 33% R&D ratio instead of the 27% median to support that expansion.
The same logic applies to unit economics. High-growth companies may be willing to accept CAC payback periods that run longer than the 12-month median if that helps them win market share. Benchmarks are a diagnostic tool, not a hard limit.
Related Blog Posts
- How AI Automates Billing for SaaS Companies
- Best AI Tools for Real-Time Capacity Planning
- How to Choose Billing Software for SaaS
- How to Track API Latency in Headless CMS
More on StackRundown
Continue on the SaaS Reviews hub, or read next: